Line Graph là dạng biểu đồ gồm một hoặc một số đường miêu tả sự thay đổi của các đối tượng trong một khoảng thời gian. Trong bài viết này, IELTS Trang Nguyễn (ITN) sẽ giới thiệu với các bạn các làm bài Writing dạng line graph, đồng thời có thêm tài liệu tham khảo cho các bạn nữa nhé!
1, Hướng dẫn chi tiết 3 bước làm dạng bài Line Graph
Áp dụng 3 bước làm bài vào đề bài mẫu sau:
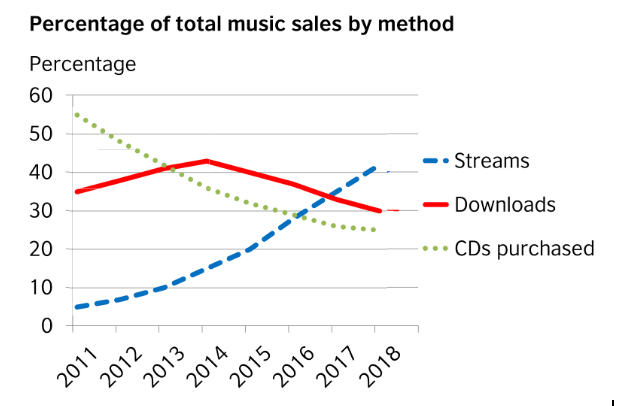
The graph below shows how people buy music. Summarise the information by selecting and reporting the main features, and make comparisons where relevant.

Bước 1: Đọc và phân tích yêu cầu đề bài mẫu dạng Line Graph
– Đọc kỹ đề bài là một việc vô cùng quan trọng vì nó giúp chúng ta xác định được đối tượng chính mà chúng ta cần report. Trong biểu đồ trên, các bạn sẽ cần nói đề tỷ lệ phần trăm của 3 phương pháp mua nhạc (Streams/Download/CD). Vậy subject trong các câu của chúng ta sẽ là “The percentage/proportion of ……” hoặc bạn có thể viết tắt là “Streams/Downloads/CDs purchased”.
– Việc đọc kỹ cũng giúp chúng ta xác định được thì của bài viết: Ví dụ như trong bài là sẽ là past tense vì mốc cuối cùng là 2018. Nếu như mốc thời gian là 2019 thì bạn sẽ dùng kết hợp cả hiện tại hoàn thành còn nếu là 2022 thì bạn có thể dùng thì tương lai đơn.
– Khi phân tích đề bài, hãy nhớ đến yêu cầu (“Report the main features”) – Đó chính là xu hướng chủ đạo, đồng thời là những con số lớn nhất, nổi bật nhất. Ví dụ trong bài này bạn nên khoanh tròn vị trí downloads tại ~2015 đạt đỉnh, hay những điểm giao nhau của các loại mặt hàng để report lại trong bài.
Bước 2: Xử lý Introduction và Overview
– Với introduction, chúng ta sẽ chỉ cần paraphrase câu hỏi:
The line graph illustrates the percentage of three methods of buying music from 2011 to 2018.
– Overview của Line Graph thì bạn sẽ cần từ 1-2 câu để nói về: Xu hướng chủ đạo (Từ đầu đến cuối thì đối tượng tăng/giảm/giao động và Độ lớn của các các đường (Có đường nào luôn lớn nhất/nhỏ nhất không?).
Ví dụ trong bài này chúng ta thấy CD purchased và Downloads giảm, Streams tăng, từ đó ta có 1 overview như sau:
Overall, there was a decline in the proportion of downloads and CDs purchased, whereas the figure for streams increased significantly over period shown.
Bước 3: Hoàn thiện bài với Body
Với phần body chúng ta thường sẽ có 2 đoạn và:
-Nếu như có 3 đối tượng trở xuống thì chúng ta sẽ sẽ chia đoạn theo các mốc thời gian (Thường tách ở các mốc đặc biệt (đạt đỉnh, giao nhau,…) )
-Nếu như có trên 3 đối tượng, chúng ta nên chia thân bài theo nhóm đối tượng (Ví dụ body 1 đối tượng A,B; body 2 đối tượng C,D)
=>Với bài này chúng ta sẽ chia Body 1: 2011-2014 (Downloads đạt đỉnh) và từ 2014 -2018.
Khi bắt đầu viết body chúng ta cần miêu tả về các tất cả các đối tượng ở thời điểm hiện tại, sau đó thì mới miêu tả tăng giảm như thế nào. Hãy ghi nhớ rằng bạn sẽ không cần quá chi tiết khi miêu tả các số liệu mà hãy nhìn vào xu hướng chung và những đặc điểm nổi bật nhất.
Đồng thời chúng ta cũng cần phải nắm rõ các ngôn ngữ miêu tả trend (tăng giảm, dao động, đạt đỉnh,…) để có thể dùng từ vựng linh hoạt.
Từ đó ta có 1 body mẫu như sau:
In 2011, CDs had the highest percentage out of all three methods, at about 55%, in comparison with 35% of downloads and 5% of streams. The next 4 years witnessed a downward trend in the proportion of CDs while the figure for streams experienced a rise of about 10%. In the meantime, downloads increased steadily, overtaking CDs in 2013, and reached a peak of over 40% in 2014.
From 2014 onwards, a gradual decrease was seen in the sales of downloads and it ended up making up for 30% in 2018. During the same period, the figure for CDs continued its upward trend to reach just over 40% in 2018, after overtaking CDs and downloads in 2016 and 2017 respectively. In contrast, the percentage of CDs witnessed a steady fall to around a quarter of the total music sales at the end of the period.
2, Tham khảo bài viết mẫu dạng bài Line Graph
Đề bài mẫu IELTS writing task 1 line graph
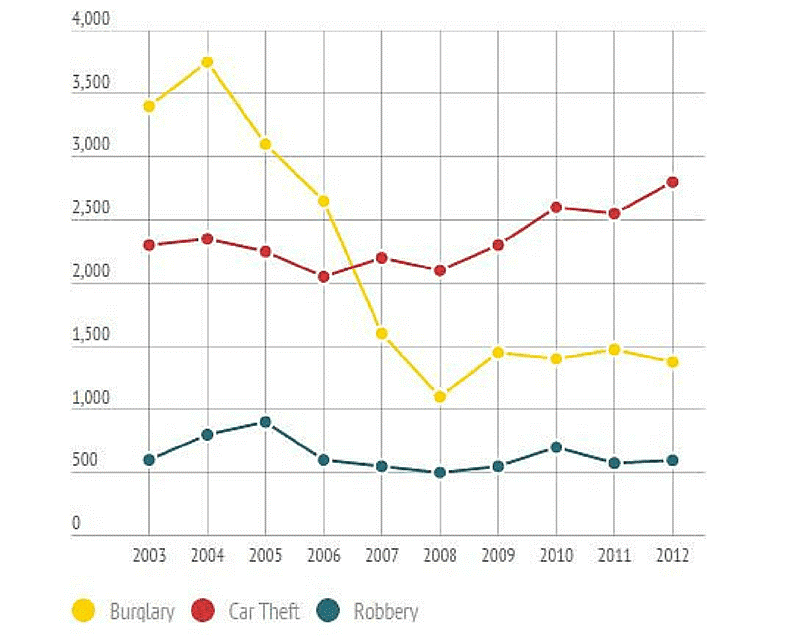
The chart below shows changes in three different areas of crime in Manchester city centre from 2003 to 2012. Summarise the information by selecting and reporting the main features and making comparisons where relevant.

The given chart illustrates how three types of crime in Manchester city centre changed between 2003 and 2012. Overall, it is clear that the number of burglaries decreased significantly while that of car thefts experienced a minimal rise over the given period. It can also be noticed that the number of robberies remained stable throughout 9 years.
At the beginning of the period, Burglary stood at nearly 3500 then increased slightly and reached its peak at about 3800 in 2004. This figure then went through a substantial decline over the next 4 years and hit its lowest point at just above 1000 in 2008. In the meantime, the number of car thefts showed an downward trend and bottomed out at 2000 in 2006 while robbery peaked at roughly 1000 in 2005 before dropping to 500 in 2008.
After 2008, the number of burglaries rose slightly to about 1400 at the end of the period. Meanwhile, robbery recovered to its starting point at over 500 in 2012 after some small fluctuations and car theft increased remarkably by nearly 1500 and finished at about 2800.
183 words
3, Tổng hợp bài viết mẫu điểm cao Writing task 1, đầy đủ các dạng bài
Download bài mẫu Writing task 1
Tài liệu trên tổng hợp đầy đủ bài mẫu, sample điểm cao các dạng bài Line graph, Table, Pie chart, Maps trong Writing task 1. Đồng thời tài liệu cũng hightlight các từ vựng giúp bạn dễ học và theo dõi.
4, Từ vựng mô tả xu hướng và cấu trúc cần dùng trong dạng Line graph trong IELTS WRITING TASK 1.
+ Cấu trúc 1:
[Predictions/ Expectations/ Anticipations/ Forcasts/ Estimates/ Evaluations/ Calculations] + [show/ reveal/ indicate] + (that) it will drop dramatically.
+ Cấu trúc 2:
It is + [predicted/ expected/ anticipated/ forecast/ estimated/ evaluated/ calculated] + that the number of cars will drop dramatically.
+ Cấu trúc 3:
The number of cars are + [predicted/ expected/ anticipated/ forecast/ estimated/ evaluated/ calculated] to drop dramatically.
Những từ ngữ mô tả xu hướng tăng giảm

Từ vựng mô tả tốc độ hay mức độ của sự thay đổ

Cấu trúc miêu tả sự thay đổi
- There+ be+ a/an + Adj + N + in + “what” + complement+ Time period
Ex: There is a dramatic increase in the proportions of urban population in all 4 countries surveyed during the period shown
S + experienced/ saw/ witnessed + a/an + Adj + N + Number+ Time period
- A/an + Adj + N + Number + was seen/witnessed + in + S + Time period
- Time period + witnessed/saw/experienced + a/an +Adj + N + in + Noun phrase
Một vài cấu trúc khác:
- Before/After + V_ing, S+V+adv
- There was a/an + adj + N1, followed by + a/an +adj+ N2
- Starting / Standing at + số liệu + năm, S+ V +adv
- S + V +adv, Ving, and then V
- While S + V, S+ V
- Cụm “for most of the period” (dùng cho phần lớn quãng thời gian của biểu đồ (>80%))
- S+ V, which was followed by …
- S+V, but later+ V
- S+V beforeV-ing
Một số cấu trúc để bắt đầu đoạn Overview
- It is clear from the graph/table…
- It can be seen from the graph/table…
- It is evident that…
- As the graph/table shows,…
- As can be seen from the graph/table,…
- As is shown by the graph/table,…
- As is illustrated by the graph/table,…
- From the graph/table it is clear,…
5, VIDEO Hướng dẫn cách làm chi tiết dạng Line Graph
Trên đây là hướng dẫn viết biểu đồ dạng Line Graph của Mr Lâm – Giảng viên tại IELTS Trang Nguyễn. Line graph không phải quá khó nếu bạn biết tư duy về cách viết. Hãy cốtrau dồi thêm nhiều từ vựng và cấu trúc hơn để diễn tả các ý thật mạch lạc bạn nhé!
Chúc các bạn học tốt!


